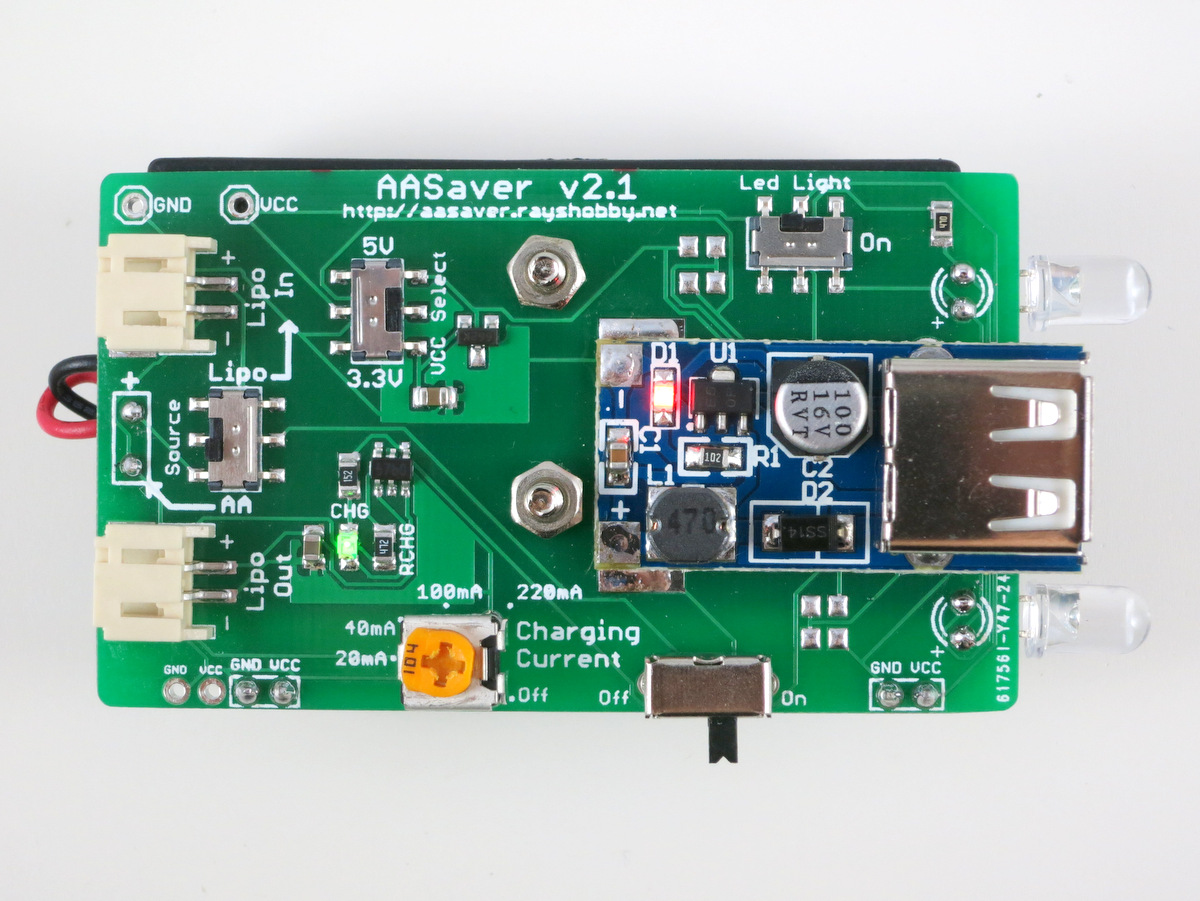
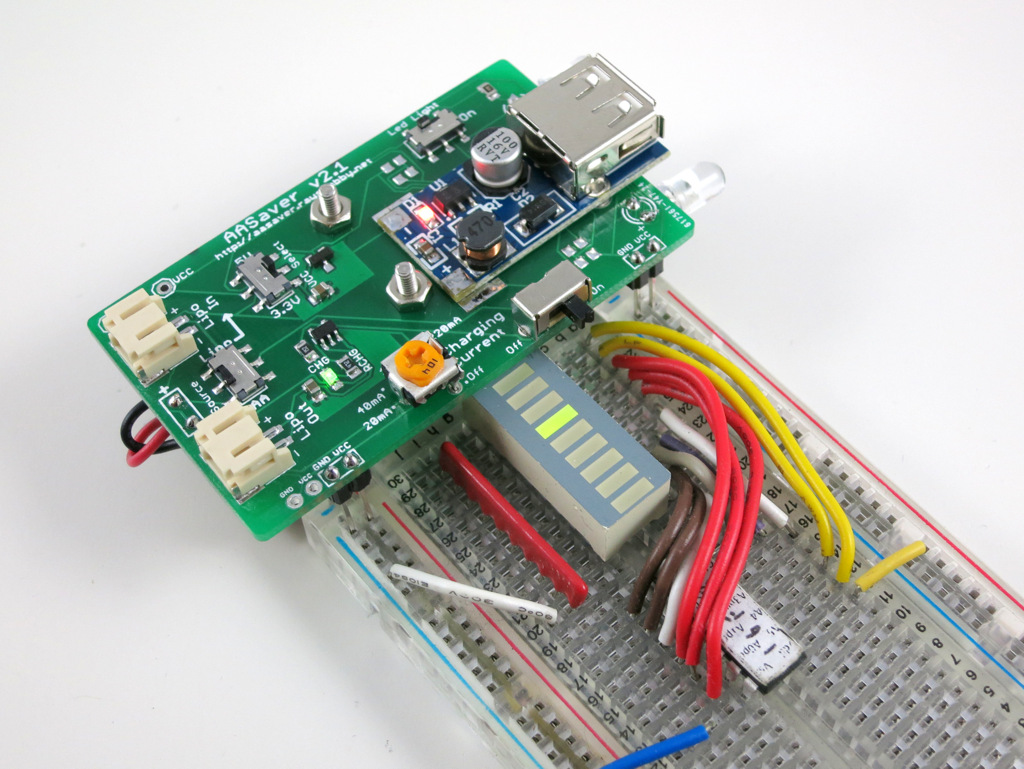
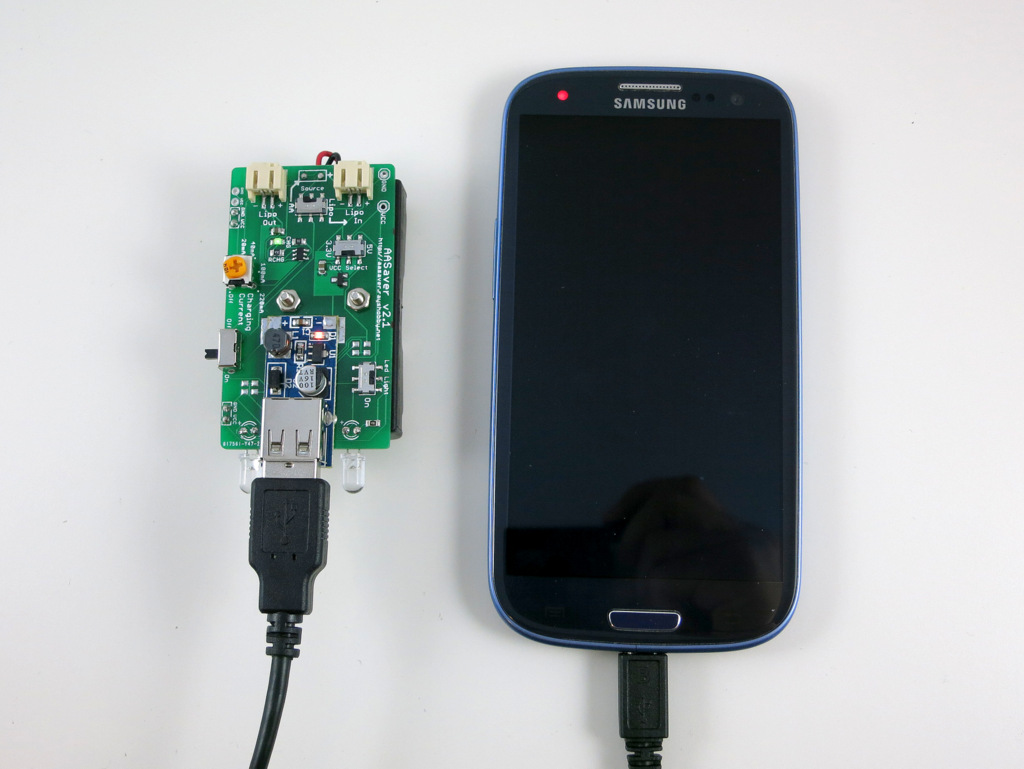
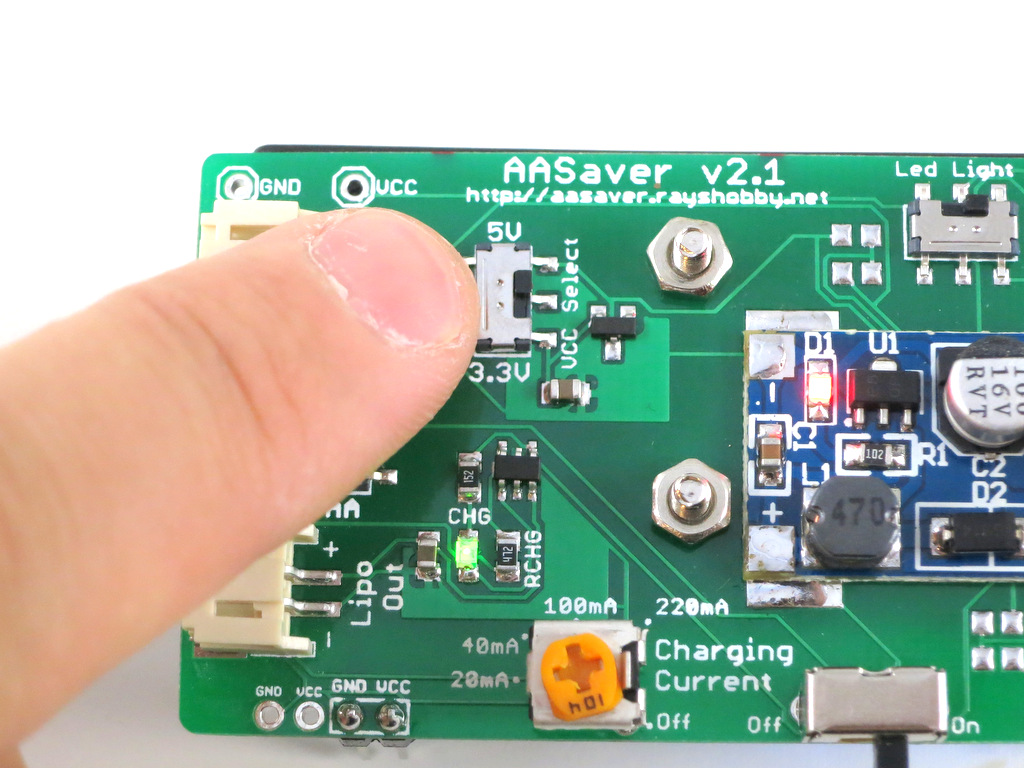
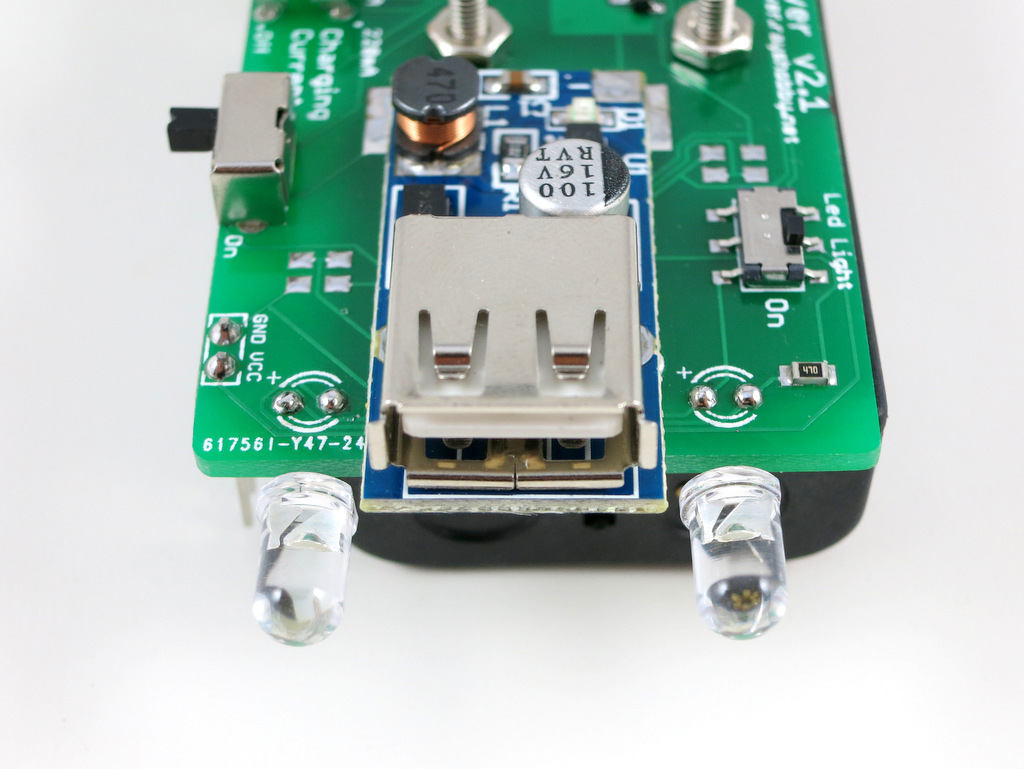
This is a quick update that AASaver has been upgraded to version 2.1. It inherits all the capabilities of version 2.0, including built-in 5V voltage booster, flashlight LEDs, breadboard power pin headers, USB port (for charging USB devices), LiPo charger (with adjustable charging current). On top of those, version 2.1 adds a 3.3V LDO and a switch you can use to choose between 5V or 3.3V output voltage. This has been the main requested feature that was missing on version 2.0. Using an LDO (instead of changing the feedback resistors) has the advantages that the voltage booster and USB port always output 5V, while the 3.3V output is only effective on the LEDs and the breadboard pin headers. Here are some pictures:
For those who are curious what AASaver is: it’s a multi-purpose voltage booster for AA/AAA batteries. I came up with this idea initially when I was cleaning up a box of ‘dead’ AA batteries one day, and was surprised that many of them actually have pretty good output voltage, like 1.2 to 1.3V. Many AA batteries rejected from gadgets (e.g. remote controls and smoke alarms) still have plenty of juice, but these gadgets don’t have built-in booster circuit to bump the voltage up, so a lot of batteries are wasted this way. I was learning voltage booster at that point and had the idea of designing a multi-purpose circuit for AA batteries, so that I can harvest the remaining energy in ‘dead’ batteries for a variety of things, like lighting up LEDs, powering breadboard circuits, charging LiPo batteries etc. That’s how AASaver was invented. It’s not restricted to used or ‘dead’ batteries — if you plug in a fresh pair of batteries, you can also use it to charge your phone or other USB gadgets. It’s a really neat, useful, and inexpensive tool that everyone should have a few of these!
Below is the original video I made for AASaver. Keep in mind that the current version has a lot more features than shown in the video, including USB charging, LiPo charging. You can even modify it to become a solar charger.
With this new version, I’ve also prepared a more detailed User Manual, with assembly and usage instructions. We have just fulfilled an order from Micro Center so in the near future you may even find AASaver in the Micro Center retail stores 🙂
Back in April, I blogged about WAi (Worthington Assembly Inc.), a circuit assembly company located only 15 minutes away from where I live. They’ve got great reputation in the maker community, and have helped projects such as Tessel, RGB-123 LED matrices to take off. I am glad to announce that we’ve now partnered with WAi to manufacture OpenSprinkler Pi (OSPi), and the first batch of 200 boards just came out from a late-evening production yesterday. Check out these awesome videos Chris Denney took during the production:
Full-speed version
Slow-motion version
Some static pictures (taken with an outdated phone, sorry about the quality!). Picture captions: 1) tapes loaded onto pick-and-place machine; 2) first board came out of the reflow oven; 3) first board after AOI inspection; 4) me holding a stack of 25 panels.
Compared to manufacturing in China, using a local facility has the unbeatable advantage of quick turn-around time. The cost may be higher than made in China, but for an open-source hardware business like us, it’s critical to remain agile and be quick about making changes. I’ve been there — waiting for months for an order to ship from China, which was painful and stressful. By the time the shipment arrived, I already wanted to move on to the next version. With WAi, we may have found just the perfect solution for our need, and this is supporting local manufacturing too, win-win! 🙂
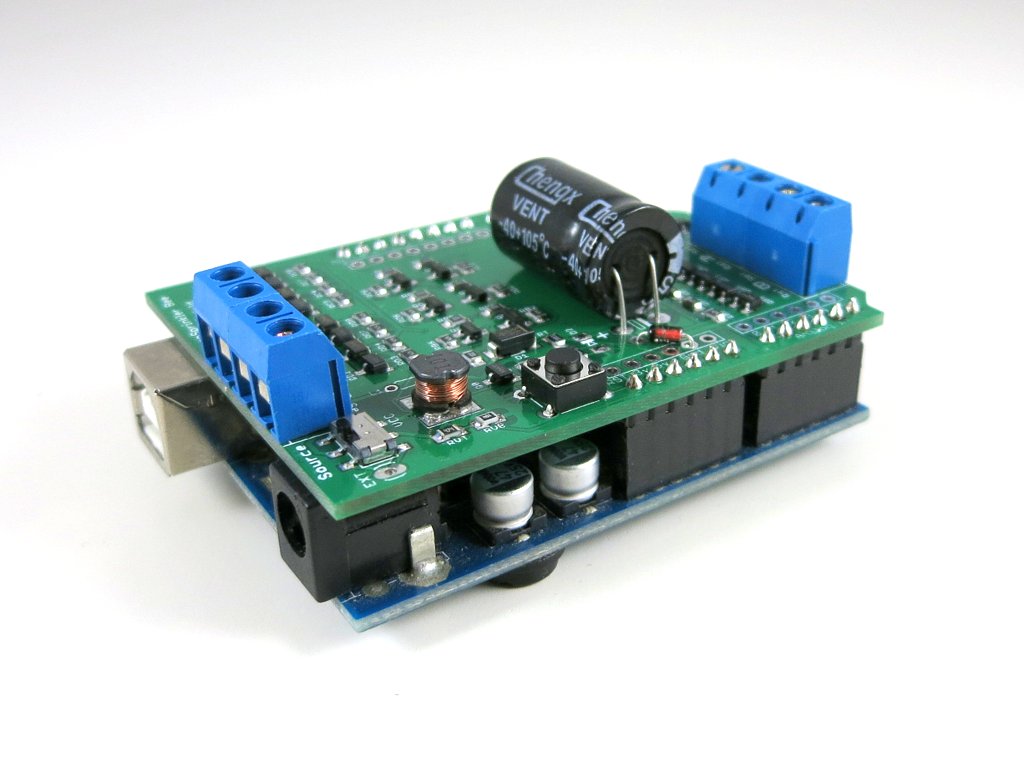
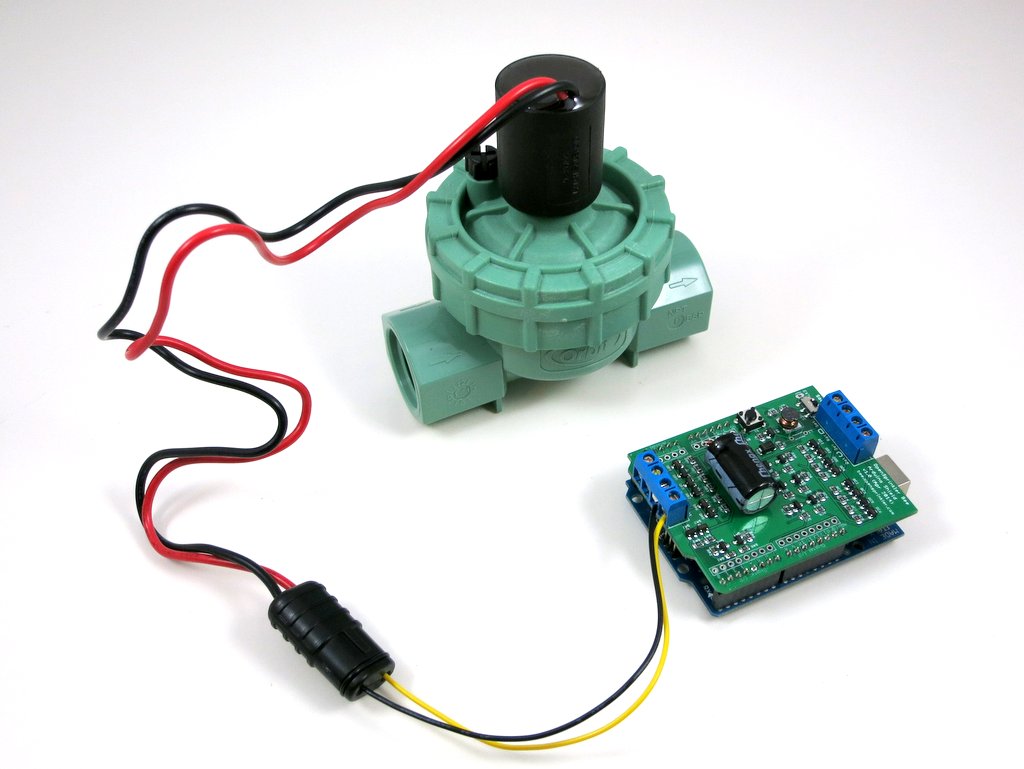
Two months ago, I wrote a blog post about the preview of OpenSprinkler Bee, which is an open-source arduino-based controller for battery-operated sprinkler valves. While that’s still in the development stage, today I am glad to announce that an Arduino shield version of OpenSprinkler Bee is completed and immediately available for purchase at the Rayshobby Shop.
So what is this Arduino shield version, and how is this different from other OpenSprinkler prodcuts that we carry? Well, an Arduino shield is a circuit board that you plug into an existing Arduino — it does not have a microcontroller chip itself, but contains additional circuitry that extends the basic functionality of an Arduino. So to use the shield, you will need to provide an existing Arduino board.
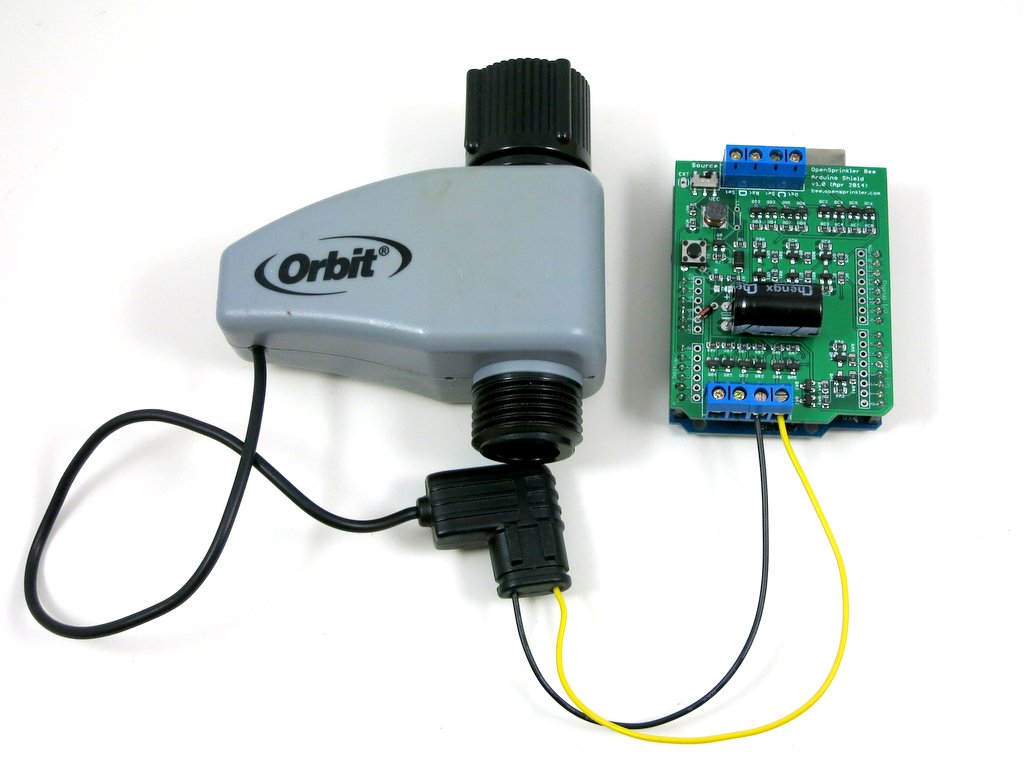
How is the OpenSprinkler Bee (OSBee) different from the other OpenSprinkler products? The main difference is that OSBee is designed to work with battery-operated sprinkler valves. These valves internally use a latching solenoid, which only draws power when you open or close the valve, and does not draw power if it remains in the same state. So it’s very efficient and suitable for battery-operated controllers. The other OpenSprinkler products, such as OpenSprinkler 2.1s, DIY 2.1u, OSPi 1.4, OSBo 1.0, are all designed for 24V AC sprinkler valves, which operate on 24V AC and require a power adapter / transformer.
While OSBee shield itself does not have built-in wireless modules, you can stack it with other Arduino shields, such as RF, WiFi, Ethernet shields, to provide web connectivity. The OSBee Arduino library has one example of using the Arduino Ethernet shield with OSBee shield to create a web interface for sprinkler control.
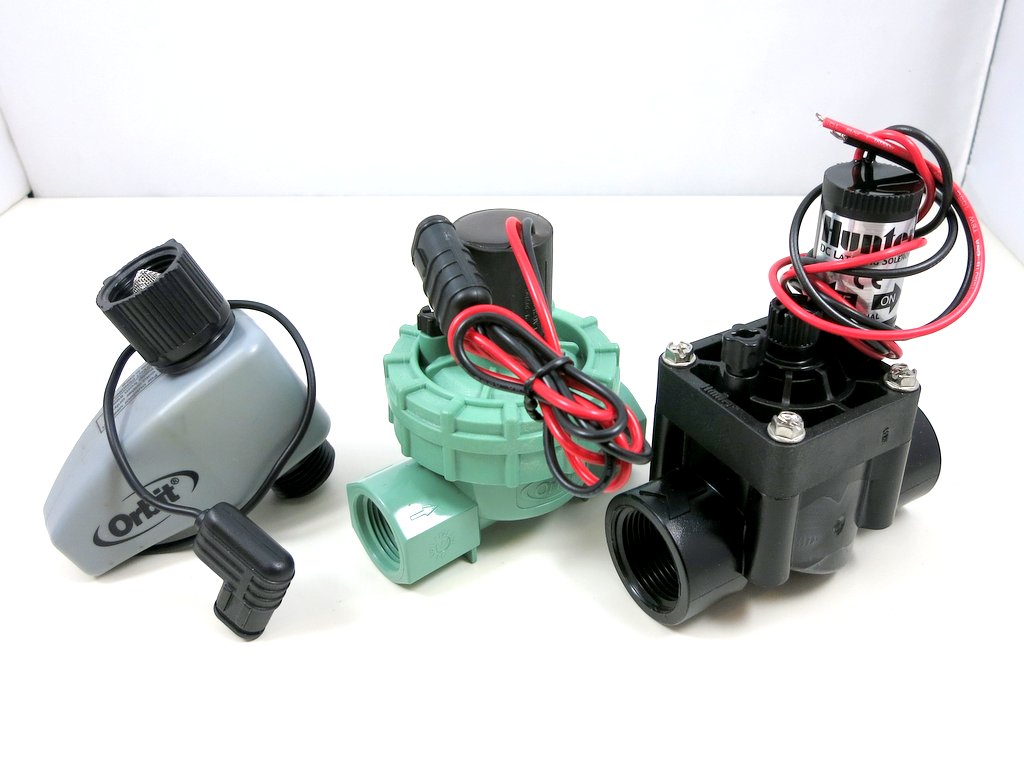
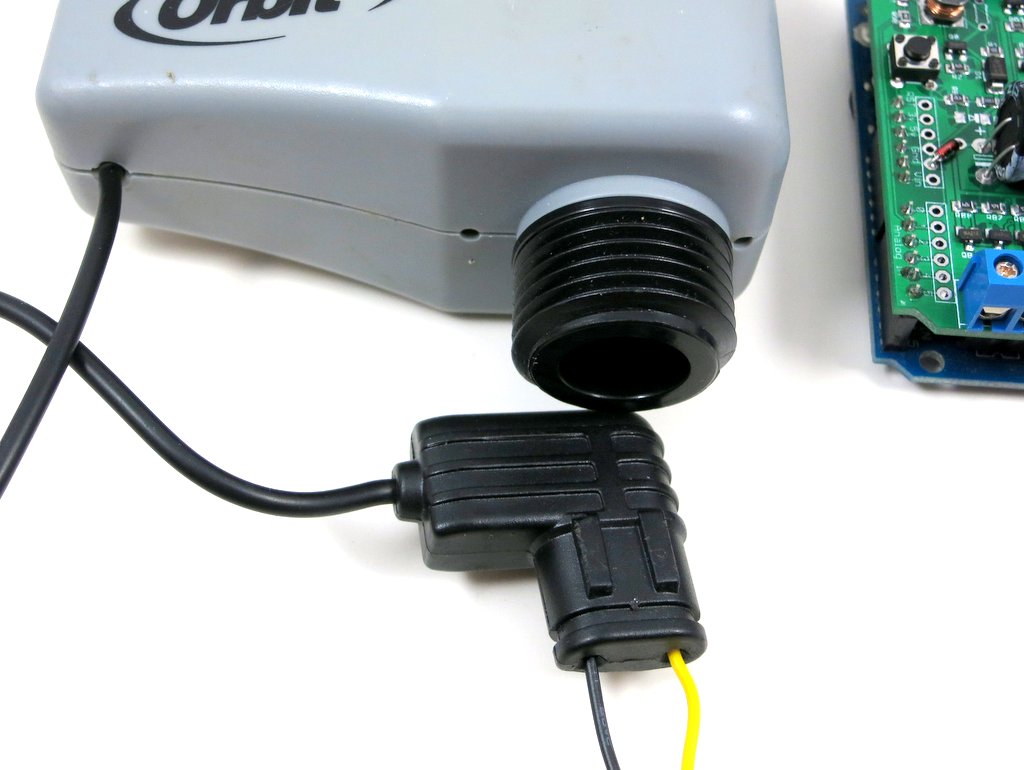
Is there any easy way to tell latching solenoid valves from 24V AC valves? Yes. Latching solenoid valves usually come with a special plug, and the two wires are usually colored differently because the solenoid has polarity. 24V AC valves usually come with just two wires colored in the same way (because AC voltage has no polarity). Here are some examples of latching solenoid valves. Note the special plugs and/or different wire colors.
For valves that come with stripped wires, simply attach them to the screw terminal blocks on OSBee shield. For valves with special plugs, you can cut and strip two pieces of wire (20 to 24 AWG): insert one end of the wire to the plug, and the other end to the screw terminal block.
How to open or close the latching solenoid valve? Electrically, latching solenoid valves have quite low coil resistance (a few ohms). To open the valve, you apply a momentary positive voltage on the coil. The specific voltage depends on the valve specification, but it typically varies between 9V to 22V. To close the valve, just reverse the voltage polarity. The important thing to keep in mind is that the voltage is applied as a pulse — usually 25 to 100 milliseconds. Because the coil resistance is so low, the instantaneous current is very high, up to a few amps. So you can’t apply the voltage continuously (or it will smoke the coil or the power supply!) In addition, it’s better to first build up the voltage into a capacitor, and then dump the charge to the valve from the capaictor.
How to generate such a high voltage from Arduino’s 5V or 3.3V pin? It’s by using a neat circuitry called ‘boost converter‘. The Wikipedia has plenty of information about how it works, but the basic principle is to use a MOSFET switch, an inductor, a diode, and a PWM signal to build up the charge into a capacitor. This way you can generate a high voltage from a low-voltage source such as AA batteries.
How to apply a voltage in both polarities? This is by using another neat circuitry called ‘H-Bridge‘. The H-Bridge is made of four MOSFET switches. By closing the pair of switches in each diagonal direction, you can apply voltage in either positive or negative polarity. Because you also need a state where no voltage is applied on the solenoid, that’s three states in total and hence two microcontroller pins are required to produce three states. Wait, why not directly use two microcontroller pins to apply the voltage? Well, microcontroller pins can neither handle high voltage nor provide high current, so you need MOSFETs to help switch high voltage and high current using only logic signals from the microcontroller.
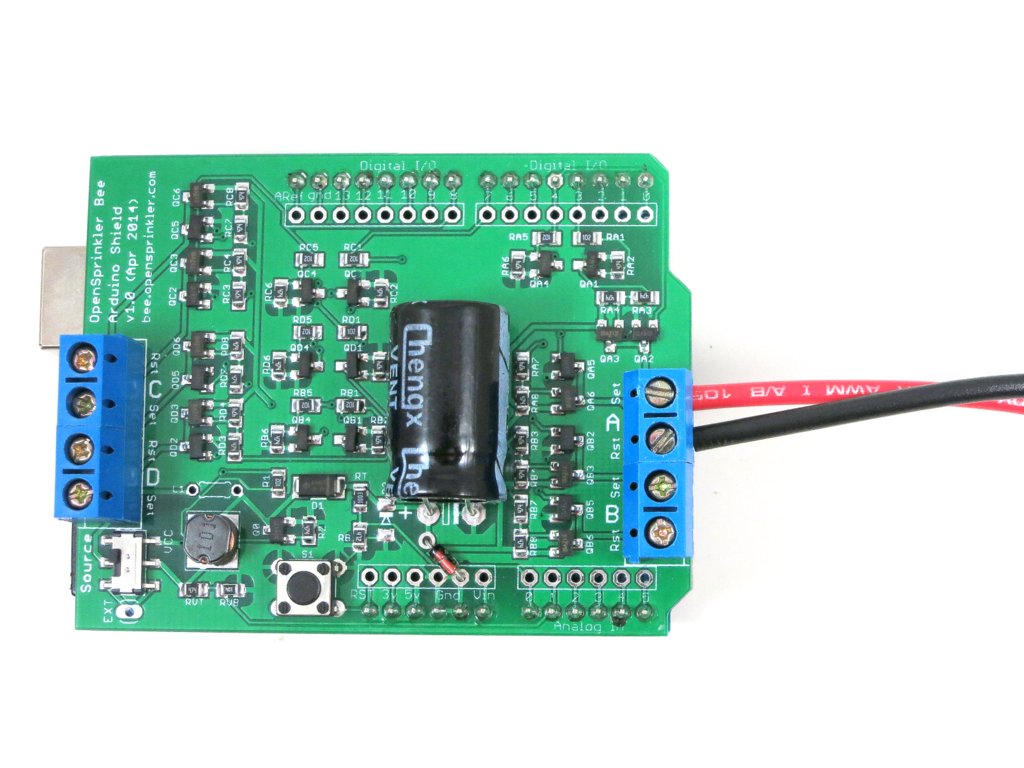
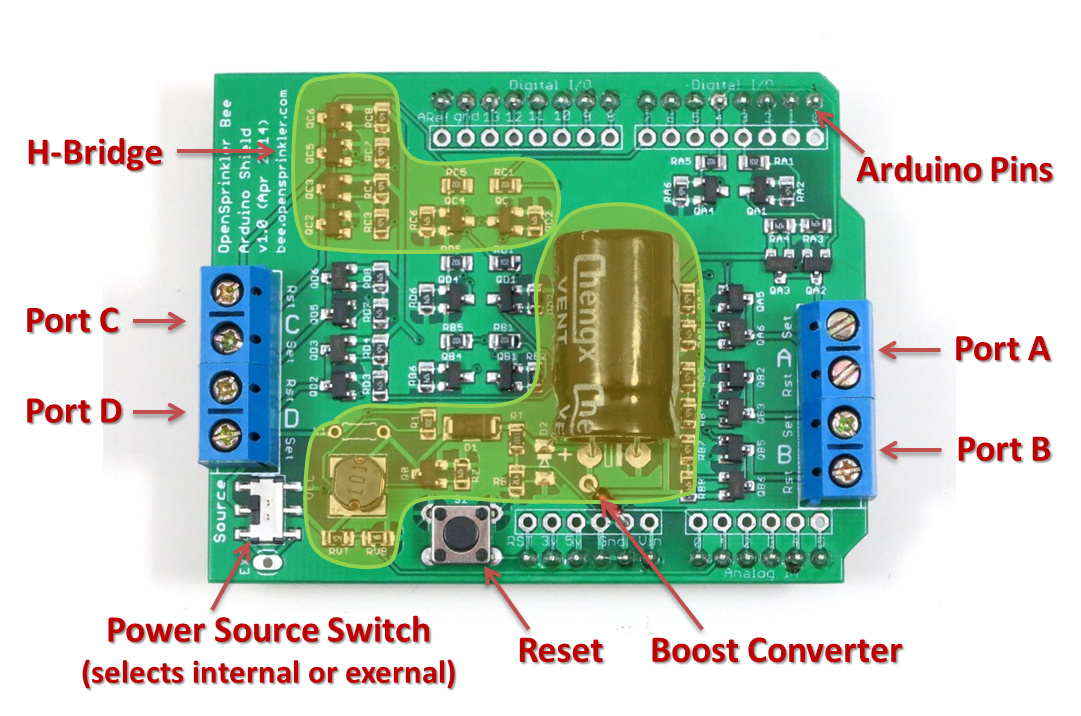
With all the technical concepts explained, here is the diagram of the various components on the OSBee Sheild:
The shield can switch 4 independent valves / zones. The boosting voltage is software adjustable — anywhere from 9V to 24V. An Arduino library with three demo programs are provided in the OSBee Github repository. For details, please refer to:
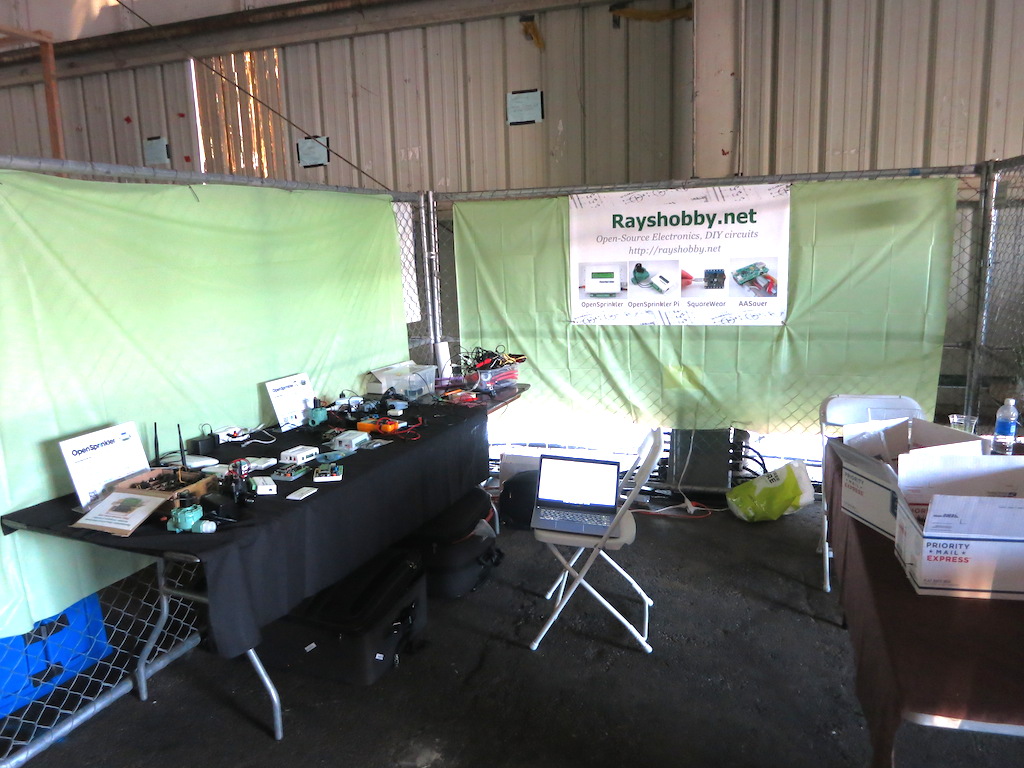
We are at the Bay Area Maker Faire at San Mateo Event Center. This year we got assigned to Station 5 (HomeGrown Village), which is a bit surprising because the past two years we’ve always been at Station 2 with the Arduino and Raspberry Pi gadgets. But this is probably an interesting change as we will be neighbors to other makers working on smart watering and home grown food. If you are at the faire, make sure to come by Station 5 and take a look at our gadgets. See you there!